The Effect of Transportation on Greenhouse Gases.
Jubilee Griffith
Department Of English, City College of New York
ENGL 21003: Writing for the Sciences
Caitlin Geoghan
May 8, 2022
Table Of Contents
SUMMARY……………………………………………………………………………….3
PURPOSE…………………………………………………………………………………5
BACKGROUND………………………………………………………………………….5
DISCUSSION………………………………………………………………………………8
COMMUNITY HEALTH CONCERNS…………………………………..…….………..10
CONCLUSIONS ………………………………………………………………………….11
APPENDICES………………………………………………………………………………12
REFERENCES………………………………………………………………………………17
SUMMARY
INTRODUCTION
Since our early adolescence we have been taught about climate change, its causes, effects and how it may potentially impact our near future. We have seen wildfires, colder summers and warmer winters as a result of climate change. So what are some contributions to climate change being generally a thing? As climate change comes from global warming, we can range anywhere from overfarming to industrialization and transportation which ultimately focusing on transportation, leads us to one of the most important factors in climate change, greenhouse gases. Greenhouse gases are gases that trap heat in the atmosphere to warm the planet. They include naturally occurring gases such as carbon dioxide, methane, nitrous oxide and water vapour and synthetic gases such as fluorinated gases according to “Greenhouse Effect 101” (NRDC).
Transportation is one of the world’s greatest innovations, from water to land. It has been able to take the weight off of people and provide them with quicker, safer and efficient ways to get around. Whether it be through train, air travel or cars, people find their ways around local and distant destinations. The amount of car sales over the years have increased drastically. There are more people driving to their destinations as there are still many still using the public transportation system.
CONCLUSION 1
Greenhouse gas emissions have increased over the years because of many factors and an increase in the amount of cars that have been on the roads.
BASIS FOR DECISION
With a large influx of traffic regarding cars, greenhouse gas emissions have increased due to the amount of cars and methods of transportation that have now entered society. It has come to a point where as our population decreases as per the effects of climate change, the amount of cars are actually increasing.
CONCLUSION 2
Greenhouse gas emissions have caused a great deal of effects such as climate change that lead to other effects such as wildfires, drought, loss of shelter and resources.
BASIS FOR DECISION
Climate change has affected our daily efforts in life. There are so many things that us as humans have learned to do in order to increase our capabilities and stabilize ourselves. Many humans farm as a way of acquiring adequate resources. Global warming is having a profound impact on the processes of soil degradation and is contributing to the desertification of areas on the planet, a phenomenon that destroys all the biological potential of affected regions, turning them into barren and unproductive land. (Corporativa 2022) Most of these communities suffer from great socioeconomic disparities whether it is through the resources that they have access to or the jobs that they acquire which makes it harder for them to receive fresh produce. People with high socioeconomic status (SES) are more likely to have healthier food habits, whereas people with low SES have dietary profiles less consistent with nutritional recommendations or dietary guidelines, hence contributing to their poorer health status. (PMC 2015). The lesser a person’s economic value is, the more likely they are not able to acquire healthy foods because they aren’t able to afford it which will lead them to find ways to get their own produce.
CONCLUSION 3
Greenhouse gas emissions cause climate change which can cause air pollution, allergies and respiratory diseases all causing other areas of issue such as changes in temperature.
BASIS FOR DECISION:
According to “Climate and Health” by the Asthma and Allergy Foundation of America, “climate change is an environmental issue and a threat to our public health..and increases water and air pollution which can cause and aggravate chronic respiratory disease, such as asthma.” Along with the changes in season that already spark allergens, unclean air will never make an allergy better.
PURPOSE
The purpose of this technical memo is to dwell on the effect of transportation and daily actions on greenhouse gases and to examine the health effects that it has on different populations. This report will open a lens to explore greatly populated cities and examine the efforts that we can make to decrease the effects of greenhouse gas emissions in the world.
BACKGROUND
HISTORY:
As we need energy to function and perform in life, a lot of that energy that we use is known as non-renewable energy. Non-renewable energy sources are sources of energy that can run out and will not be replenished if overused, meaning that it should be used for its values and used sparingly. These non-renewable resources are known as fossil fuels discovered by Svante Arrhenius, a Swedish scientist who concluded that fossil fuel combustion may result in enhanced global warming. Fossil fuels are what we like to call greenhouse gases. Finding that “the average surface temperature of the earth is about 15℃ because of the infrared absorption capacity of water vapor and carbon dioxide” (Enzler), we can conclude that this is known as the greenhouse effect. While at this time human activity was thought to not be the specific reason for the rise in the possibility of global warming, it was also believed that the Earth would renew itself and replenish its air from pollution. “Since the start of the Industrial Revolution and the advent of coal-powered steam engines, human activities have vastly increased the volume of greenhouse gases emitted into the atmosphere. It is estimated that between 1750 and 2011, atmospheric concentrations of carbon dioxide increased by 40 percent, methane by 150 percent, and nitrous oxide by 20 percent. In the late 1920s, we started adding man-made fluorinated gases like chlorofluorocarbons, or CFCs, to the mix.” (Denchak 2019). In 1988 it was finally acknowledged that the climate was warmer than any period since 1880. These greenhouse gases include natural gases, coal and oils.
SITE DESCRIPTION:
California is a generally large state with the highest population in the United States, where it carries over 39.5 million people. In 1900, California was home to fewer than 2 million people and by 1950 the population had reached 10 million. California’s population more than tripled in the last half of the 20th century , and its growth rate was much higher than that of the rest of the United States From 2010 to 2020, California’s population grew by 5.8% based on the census which was slower than the rate of growth in the rest of the nation leading to the loss of a seat in the US House of Representatives for the first time in California’s history. (Johnson 2022). We can see the change in population over the decades and how it has decreases all while still holding the title of the most populous state in America in the graph below:
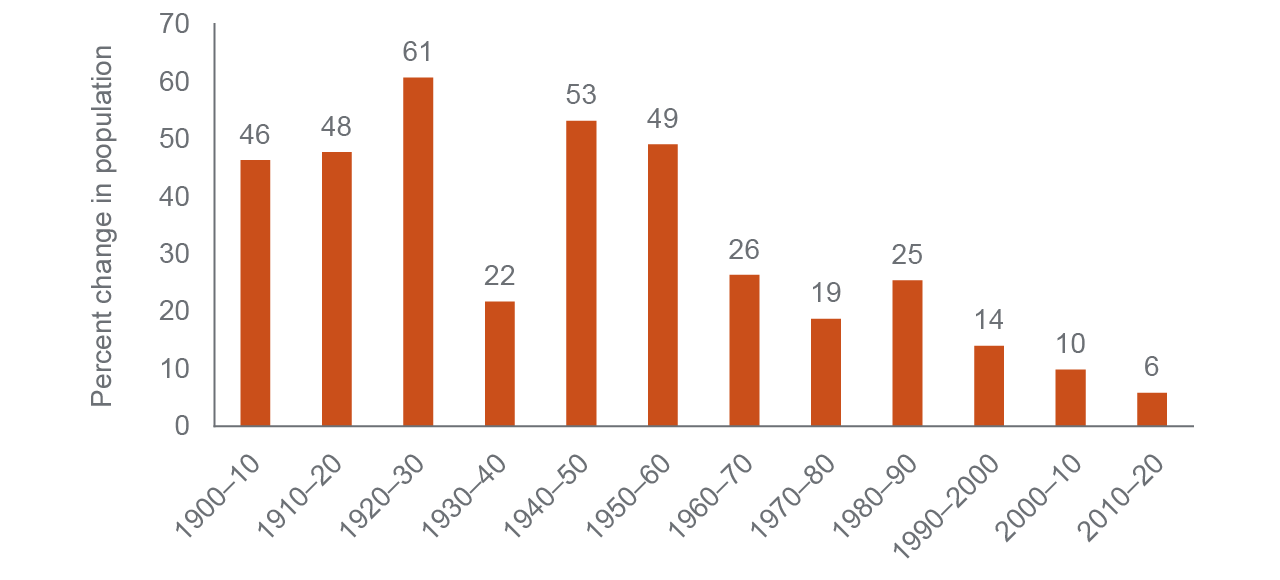
*Percent change in population of California from 1900-2020.
As there are many people in California, the car population is also a stunning 14 million, where it is the highest of all states.This is likely because of the high population and the fact that, children the age of 15 are allowed to get their learners permits and acquire their minor driving license at 16, whereas in more Eastern states, children the ages of 16-17 are allowed to have a junior minor license that prevents them from driving at certain times of the day and without an adult that is fully licensed. This difference means that younger people are getting cars much quicker in California, which contributes to the fact that the car population is increasing at a quicker and higher rate. The graph below shows the difference in automobile registrations in 2020:
* California holds the title for state with the highest amount of car populations where it exceeds more than 50% more than other states.
DEMOGRAPHICS
Regarding demographics, California is home to 39% Latino, 35% White, 15% Asian American or Pacific Islander, 5% Black, 4% multiracial, and fewer than 1% Native Americans or Alaska Natives, according to the 2020 Census. With a population of 39.5 people, California is home to over 10 million immigrants making at least 27% foreign born (Johnson 2022).
DISCUSSION
California resides on the West Coast of the United States where it typically experiences very high temperatures. These temperatures can be a result of climate change and its effects. With such a large population they are bound to burn more energy in homes to cool themselves down. “The burning of coal, oil, and natural gas to produce electricity and heat accounts for one-quarter of worldwide human-driven emissions, making it the largest single source… responsible for about 27.5 percent of U.S. emissions in 2017, with carbon dioxide the primary gas released (along with small amounts of methane and nitrous oxide), mainly from coal combustion”(Denchak 2019). The use of energy plays a large role in greenhouse gas emissions along with transportation. Burning petroleum-based fuels such as gasoline and diesel to run the many different transportation systems in the world such as trucks and cars. With the large influx of larger cars, the amount of gas being produced is at a very large amount. Trucks and cars are actually responsible for more than 80% of carbon emissions meaning that it emits a large percent of pollution into the air raising many health concerns along with the chances of global warming increasing. This can lead us to the conclusion that mass transit systems such as trains and buses are not being utilized to their full and efficient potential. These methods of transportation are designed to limit the amount of greenhouse gas emissions as there are less trains and buses then there clearly are cars. The chart below shows that cars hold the greatest value of transportation and second with more than 75% lower comes public transit:
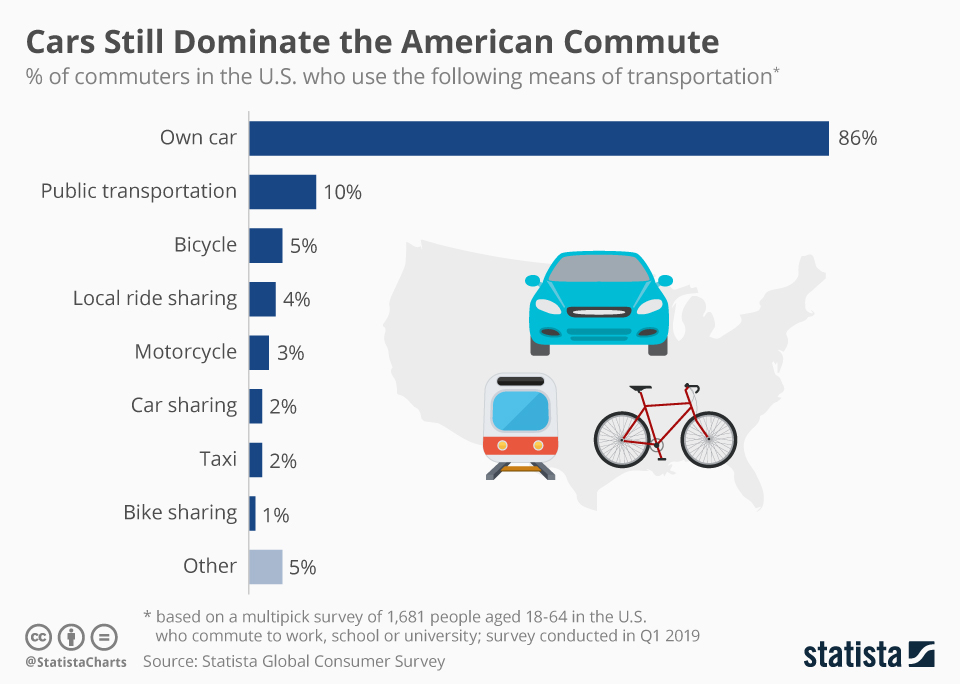
*Percentages of commute across the United states and the type.
The amount of emissions that are being formed from this method of transport, have caused a vast majority of the air pollution that we know of today. Air pollution causes poor air quality which means that they are prone to many more natural disasters. Taking a look at our focus, California has been a victim of air pollution. “Nearly every year, California experiences major wildfires that can be devastating to the environment and communities throughout the state. These fires tend to frequently and tragically displace California locals from their homes due to property destruction, poor air quality, extreme heat, and other consequences”(Frontline 2022). Below is a table that shows the amount of fires that have devastatingly burned many parts of California.

COMMUNITY HEALTH CONCERNS
Climate change affects air pollution, allergens and more. This change in air quality can be a ringer for chronic respiratory diseases such as asthma and allergies. As warmer temperatures from climate change cause flowers to sprout earlier and increase the emitted amount of carbon dioxide, those changes cause an increase in pollen resulting in a stronger airborne allergen that increases allergenic symptoms. “Increased temperatures due to climate change lead to increased ground-level ozone, which cause airway inflammation and damages lung tissue.”(AAFA 2021) While this may seem like it may affect the people only with occurring allergies, it does not. Larger amounts of pollen can spark allergies amongst people that dont have allergies ultimately leading them to develop allergic symptoms. The chart below shows the different effects that climate change can have on human health and what particularly about climate change can help the fact.
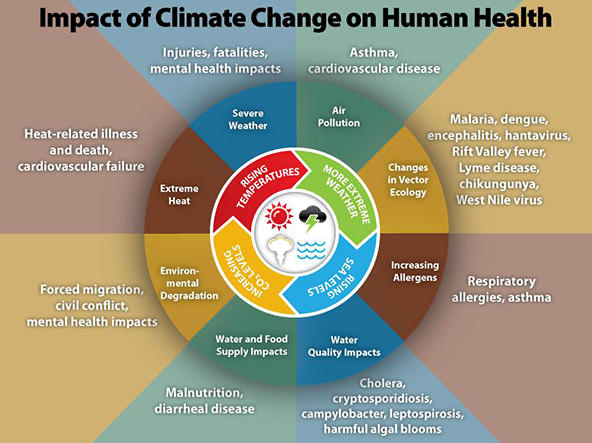
*Impact of Climate Change on Human Health: Different effects from different factors of climate change.
Along with the temperature increases, many areas in the world tend to dry, basically turning into desert. The rate that soil is being lost is 10-100 times faster than it forms according to a research source. With climate change on the rise “floods, drought, storms and other types of extreme weather threaten to disrupt, and over time shrink, the global food supply. More than 10% of the world is undernourished, and food shortages will also lead to an increase in cross border migration.
CONCLUSION
Many people do not realize how many greenhouse gas emissions we create just by our daily actions and it is so much worse for greater populations. Public transportation and private transportation is so prevalent in an overpopulated region. However, public transportation in a metropolitan city is much more helpful in saving energy than everyone using private energy. For example, more people using their individual cars will create more carbon emissions than people using a bus that helps preserve all the cars’ energy in the end. The over-populated amount of greenhouse gas emissions caused by the large amount of cars can cause a great toll of effects in a population and the whole world generally. So what can we say about this? We should utilize public transit and limit the amount of emissions that we create as humans.
REFERENCES
Alkerwi, A., Vernier, C., Sauvageot, N., Crichton, G. E., & Elias, M. F. (2015, May 11).
Demographic and socioeconomic disparity in nutrition: Application of a novel correlated component regression approach. BMJ open. Retrieved May 8, 2022, from https://www.ncbi.nlm.nih.gov/pmc/articles/PMC4431064/
Asthma and Allergy Foundation of America. (2021). AAFA.
Asthma and Allergy Foundation of America. Retrieved April 25, 2022, from https://www.aafa.org/climate-and-health/
Corporativa, I. (2022). The Consequences of the Greenhouse Effect: from Desertification to Floods.
Iberdrola. Retrieved April 25, 2022, from https://www.iberdrola.com/sustainability/greenhouse-effects-consequences-and-impacts
Denchak, M. (2019, July 16). Greenhouse effect 101.
NRDC. Retrieved April 25, 2022, from https://www.nrdc.org/stories/greenhouse-effect-101
Enzler, S. M. (n.d.). Water treatment solutions. Lenntech Water treatment & purification.
Retrieved May 8, 2022, from https://www.lenntech.com/greenhouse-effect/global-warming-history.htm
Frontline Wildfire Defense System. (2020, September 30). California wildfires history & statistics: Frontline wildfire defense.
Frontline. Retrieved April 25, 2022, from https://www.frontlinewildfire.com/california-wildfires-history-statistics/
Nunez, C. (2019, May 13). Carbon dioxide in the atmosphere is at a record high. Here’s what you need to know. Environment.
Retrieved April 25, 2022, from https://www.nationalgeographic.com/environment/article/greenhouse-gases
Person, Johnson, H., McGhee, E., & Mejia, M. C. (2022, March 28).
California’s population. Public Policy Institute of California. Retrieved May 8, 2022, from https://www.ppic.org/publication/californias-population/
Phillips, A. M., Barboza, T., Vives, R., & Greene, S. (2021, October 7). Heat waves are far deadlier than we think. how California neglects this climate threat. Los Angeles Times.
Retrieved April 25, 2022, from https://www.latimes.com/projects/california-extreme-heat-deaths-show-climate-change-risks/
APPENDICES
Appendix A
Appendix B

Appendix C
Appendix D
Appendix E